Projects
01
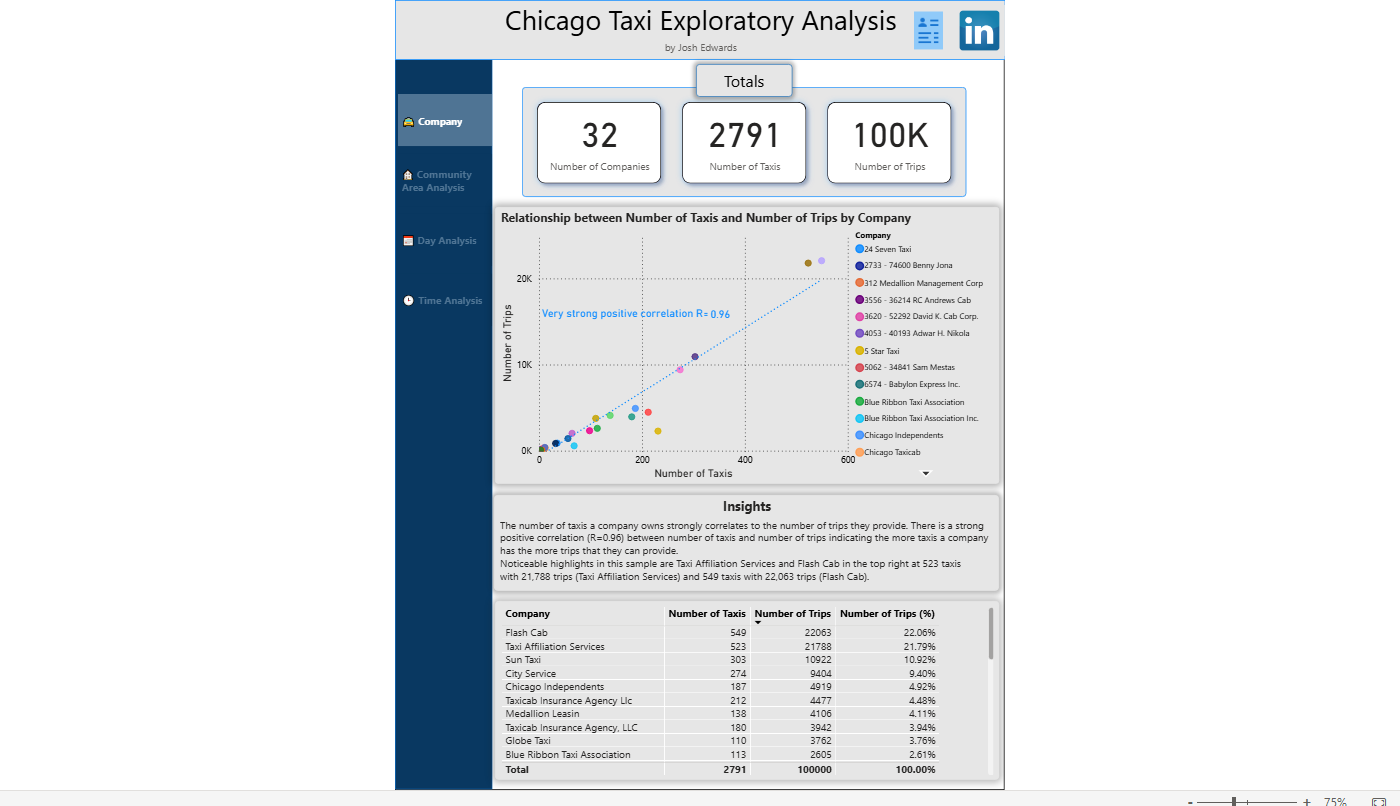
Chicago Taxi Analysis
A data exploration asking how a Chicago taxi company could grow, looking at demand by company, neighbourhood, and time of day using BigQuery and Python.
PythonBigQueryGoogle ColabPower BI
02
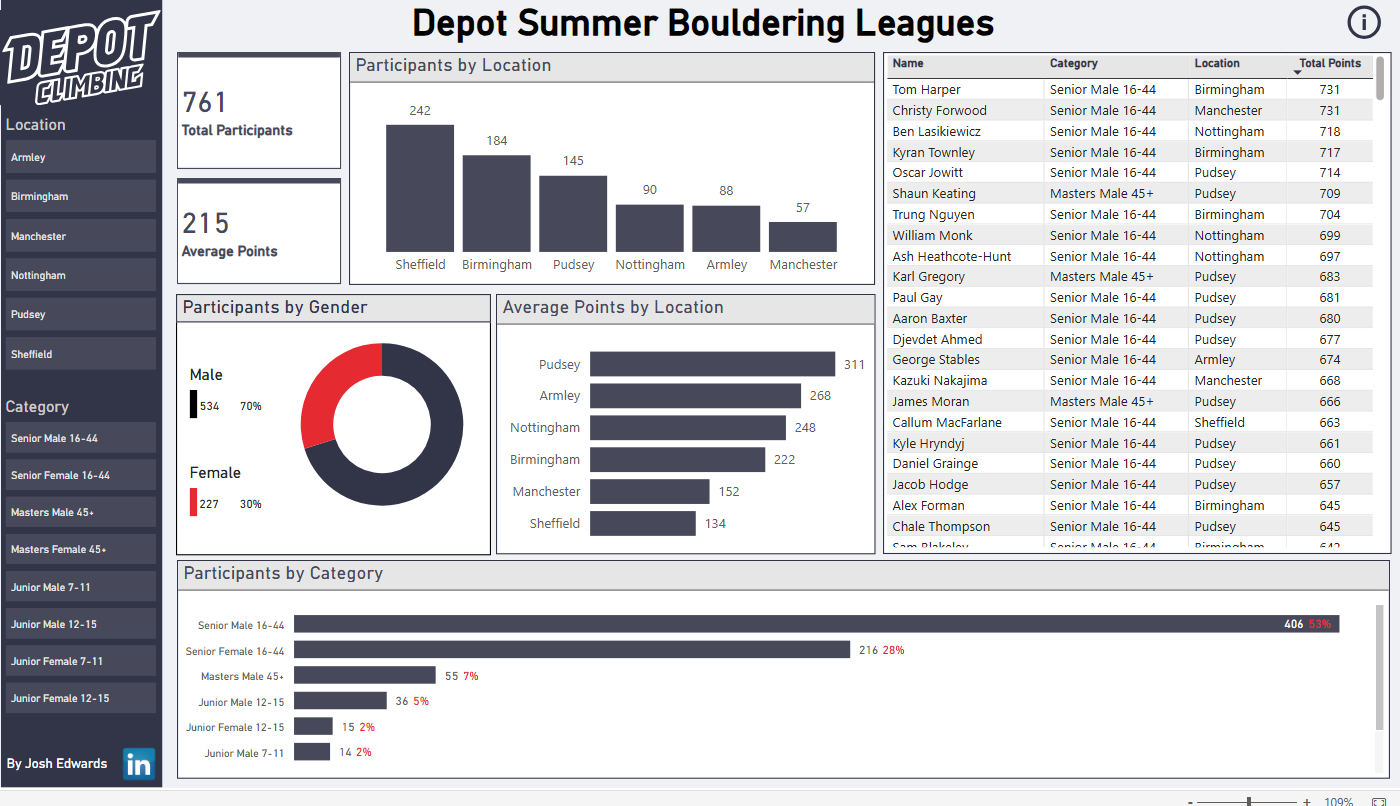
Bouldering League Report
761 climbers. 6 locations. 3 rounds. A Power BI dashboard built to track every result of the 2024 Depot Climbing Summer League.
Power BIPower QueryExcel
03
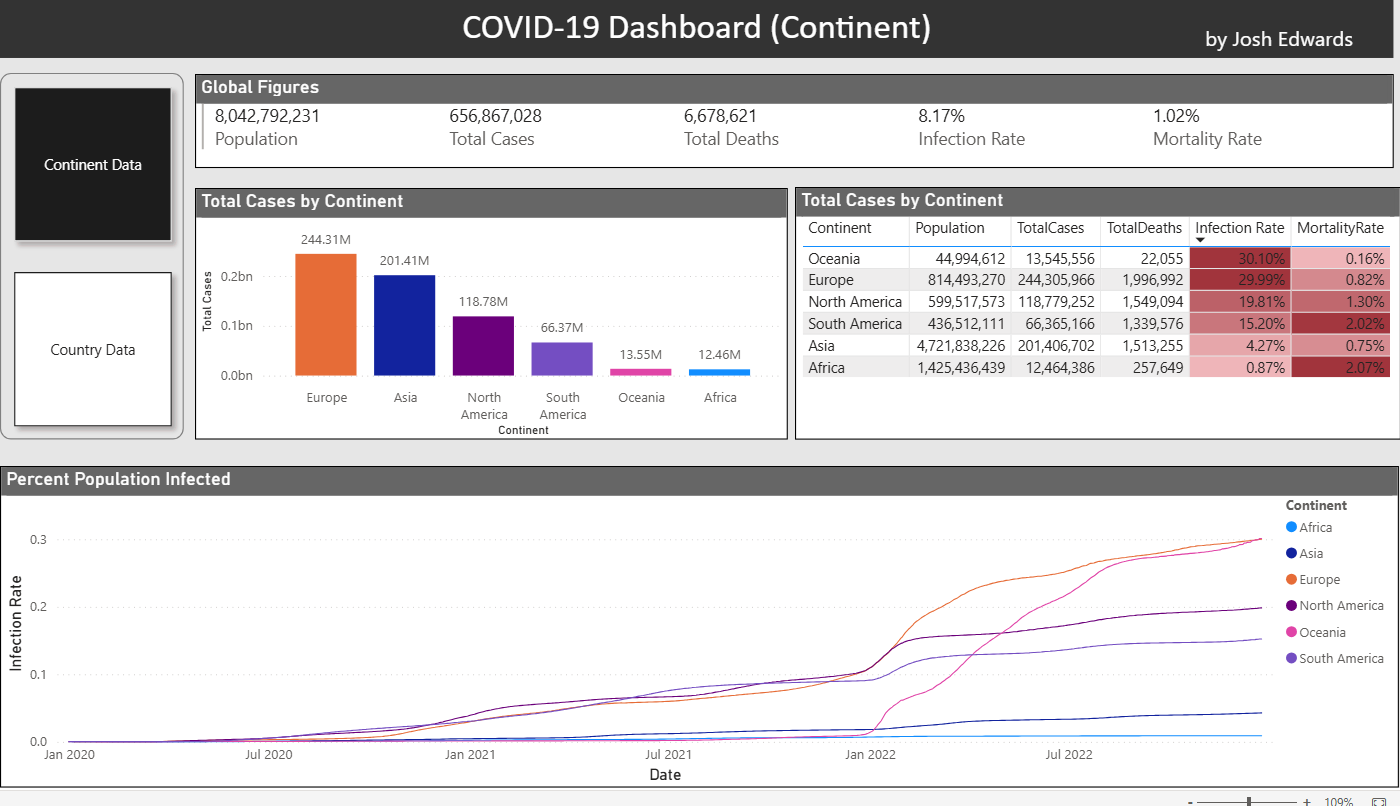
COVID-19 Analysis
Where did COVID hit hardest, and how deadly was it by region? Global infection and mortality data explored with SQL and visualised in Power BI.
SQLPower BI